Trusted by:

What Our Clients Are Saying

Our formulas are the very foundation of our business and we like knowing they can’t get lost or corrupted, Mar-Kov’s ability to store and instantly access everything from finished goods batch numbers to raw material inventory, and chemical specifications really sold us because it gives us complete control and transparency.

Stephanie KellyQuality Manager, Titan Coatings International

After 10+ years of using the same software, we were very reluctant to change. With Mar-Kov, things have worked out better than expected – we replaced all the functionality we had under our old software and have added new capabilities as well. Now we are in a really good place

John DalyPresident of Surfacelogix

With Mar-Kov, we’re more in the loop and more informed about our business and manufacturing processes. Mar-Kov has more data which is better because it provides insights and answers if anyone in management has a question.

Lucas BerryDirector of Operations, Acrylux Paint Mfg. Co

Dashboard Features That Power Smart, Fast Decisions

mar-kov software. Mar-Kov Software Interface

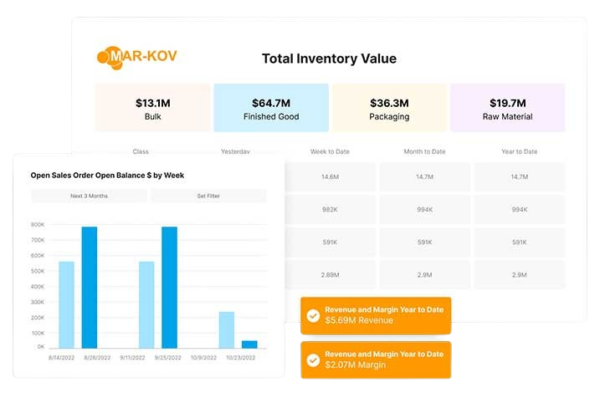
Financial & Margin Analytics

  • Visualize cost-per-batch, per-SKU, and per-customer performance. 
  • See real-time margin trends across product lines and facilities. 
  • Make informed pricing or resource allocation decisions fast. 
  • Track variances between estimated and actual costs in real time. 
  • Identify high-cost, low-margin products before they impact profitability. 
  • Compare financial KPIs across periods, customers, and production teams. 

Total Visibility

  • Gain a centralized view of production, inventory, quality, and compliance, all in one platform. 
  • See real-time updates across batches, facilities, lines, and teams. 
  • Instantly track material movements, job statuses, and inventory usage without switching systems. 
  • Unify data from operations, QA, and finance to eliminate blind spots and manual handoffs. 
  • Enable every department to make decisions based on the same live data; no delays, no disconnects. 
  • Build a single source of truth for your entire manufacturing process, from raw material to shipped product. 
Asset Valuation and COGS

KPI Drill-Down & Filtering

  • Filter dashboards by facility, shift, product family, or team. 
  • Drill into underperforming metrics in two clicks, no manual reporting needed. 
  • Empower teams to self-identify areas for improvement. 
  • Pinpoint root causes behind KPI anomalies using historical data. 
  • Customize filters and views for continuous improvement teams. 
  • Export drill-down reports for audits, planning, or team reviews. 

Role-Based Reports and Dashboards

  • Dashboards tailored to operations, quality, finance, or executive users. 
  • Control who sees what, from plant floor to boardroom. 
  • Keep each stakeholder focused on what matters to them. 
  • Reduce information overload with filtered, relevant views. 
  • Support data-driven accountability across departments. 
Real-Time Batch-Level Financials ​
Reporting Your Way

Real-Time Production Dashboards

  • Monitor live batches by product, line, or facility; all in one place. 
  • See yield, run times, and operator performance in real time. 
  • Identify bottlenecks and delays before they impact throughput. 
  • Track labor utilization and shift performance instantly. 
  • View production status against planned schedules. 

Email Alerting

  • Push alerts via email for critical operational, QA, inventory, and compliance events. 
  • Receive scheduled reports directly in your inbox.  
  • Ensure operators, managers, and executives stay informed in real time, wherever they are. 
mar-kov software. Mar-Kov Software Interface

99.9%

Inventory accuracy year over year

2X

Production without hiring additional staff

30%

Improvements in margins

60

Seconds to run a mock recall

12

Months ROI

Ready to Turn Real-Time Data into Real Results? 

Talk to a Mar-Kov Expert for free

Drive Agility with These Key Business Benefits

1

Real-Time Operational Awareness

Access live insights across production, inventory, and quality. Make decisions with up-to-the-minute data, no more waiting on reports.
2

Instant Response to Exceptions

Act the moment a process drifts off course. Real-time alerts notify the right stakeholders to correct issues before they escalate.
3

Confident, Data-Driven Decision-Making

Visualize financial and operational performance by product, team, or timeframe. Prioritize improvements that truly move the needle.
4

Streamlined Accountability

Give each team the KPIs that matter most to them. No clutter, just clear insights tied directly to ownership.
5

Higher First-Pass Yield

Reduce rework by catching deviations early. Identify at-risk batches and intervene before quality issues escalate.
6

Custom Dashboards for Every Role

From the shop floor to the boardroom, tailor each dashboard to the KPIs that matter to that function - speeding up actions across the business.

Expertise Across Industries

Food 

Monitor allergen alerts, inventory turnover, and yield in real time to minimize recall risks and reduce spoilage costs.

Ice Cream 

Track labor variance, freezer capacity, and line output by SKU. Set alerts for temperature or shift inefficiencies.

Chemicals 

Get alerted on pH and viscosity deviations. Monitor raw material usage across blends to control cost and compliance.

Cosmetics 

Visualize batch quality and inspection rates across multiple contract manufacturers.

Pharmaceuticals 

Catch yield variances and QA delays. Surface exceptions across product families and lots with full traceability.

Beverages 

Track line performance, temperature-sensitive SKUs, and packaging bottlenecks. Set proactive alerts for deviations.

Alcohol 

Monitor fermentation, labor productivity, and cleaning events. Alert on excise-critical steps or missed logging.

Commercial Bakery 

Monitor packaging delays, batch cycle times, and allergen-related cross-contact risks before they become production issues.

Dietary Supplements 

Track first-pass yield and QA holds. Get notified on failed tests, missed label specs, or out-of-tolerance materials.

Paints & Coatings 

Visualize pigment use, curing time trends, and adhesion failures before they become production delays.

Work Smarter With Seamless Integrations

Frequently Asked Questions